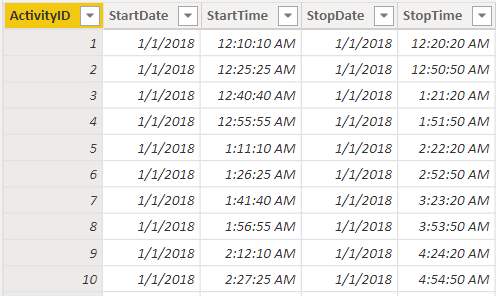
In a previous video, the importance and benefits of splitting DateTime columns into separate Date and Time columns was discussed. For example, a table with DateTime columns of StartDateTime and StopDateTime should be transformed in the query editor to the below.
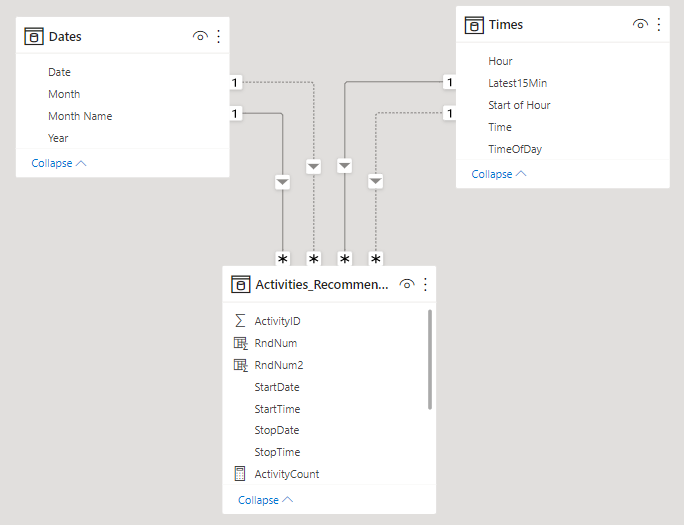
You can then add a date table and a time table to your model. In this example, the active relationship is to StartTime and inactive is to StopTime.
There are many examples out there for date tables, but not as many for time tables (this makes sense, as you should eliminate the time component whenever only day-level analysis is needed). A previous article provides date tables (in either DAX or M) that do not require any Sort-By Columns.
Below is the DAX or M code to generate a typical time table, with several useful dimensions (both create the same table). The tables generated by the code below are at the minute-level granularity (one row for every minute in a day). Examples to adjust the granularity by changing the first line are shown below each.
M Time Table
let
  Source = List.Times(#time(0, 0, 0), 24 * 60, #duration(0, 0, 1, 0)),
  #"Converted to Table" = Table.FromList(Source, Splitter.SplitByNothing(), null, null, ExtraValues.Error),
  #"Renamed Columns" = Table.RenameColumns(#"Converted to Table", {{"Column1", "Time"}}),
  #"Changed Type" = Table.TransformColumnTypes(#"Renamed Columns", {{"Time", type time}}),
  #"Inserted Hour" = Table.AddColumn(#"Changed Type", "Hour", each Time.Hour([Time]), Int64.Type),
  #"Inserted Start of Hour" = Table.AddColumn(#"Inserted Hour", "Start of Hour", each Time.StartOfHour([Time]), type time),
  Added_HalfHrs = Table.AddColumn(#"Inserted Start of Hour", "HalfHr", each #time(Time.Hour([Time]), 30 * Number.RoundDown(Time.Minute([Time]) / 30), 0), type time),
  Added_QtrHrs = Table.AddColumn(Added_HalfHrs, "QtrHr", each #time(Time.Hour([Time]), 15 * Number.RoundDown(Time.Minute([Time]) / 15), 0), type time),
  Added_TimeOfDay = Table.AddColumn(
    Added_QtrHrs,
    "TimeOfDay",
    each
      if [Hour] >= 6 and [Hour] <= 11 then
        Text.Repeat(Character.FromNumber(8203), 3) & "Morning"
      else if [Hour] >= 12 and [Hour] <= 17 then
        Text.Repeat(Character.FromNumber(8203), 2) & "Afternoon"
      else if [Hour] >= 18 and [Hour] <= 23 then
        Text.Repeat(Character.FromNumber(8203), 1) & "Evening"
      else
        Text.Repeat(Character.FromNumber(8203), 4) & "Night",
    type text
  ),
  #"Added Custom" = Table.AddColumn(Added_TimeOfDay, "AM/PM", each if [Hour] >= 12 then "PM" else "AM", type text)
in
  #"Added Custom"
Example Changes
Source = List.Times(#time(0, 0, 0), 24 * 60 * 60, #duration(0, 0, 0, 1)) // 1 second granularity
Source = List.Times(#time(0, 0, 0), 24 * 60 / 5, #duration(0, 0, 5, 0)) // 5 minute granularity
DAX Time Table
Time_DAX =
VAR basetime =
    SELECTCOLUMNS (
        GENERATESERIES ( TIME ( 0, 0, 0 ), TIME ( 23, 59, 0 ), TIME ( 0, 1, 0 ) ),
        "Time", [Value]
    )
VAR output =
    ADDCOLUMNS (
        basetime,
        "Hour", HOUR ( [Time] ),
        "AM/PM", IF ( HOUR ( [Time] ) >= 12, "PM", "AM" ),
        "TimeOfDay",
            SWITCH (
                TRUE (),
                HOUR ( [Time] ) >= 18, REPT ( UNICHAR ( 8203 ), 1 ) & "Evening",
                HOUR ( [Time] ) >= 12, REPT ( UNICHAR ( 8203 ), 2 ) & "Afternoon",
                HOUR ( [Time] ) >= 6, REPT ( UNICHAR ( 8203 ), 3 ) & "Morning",
                REPT ( UNICHAR ( 8203 ), 4 ) & "Night"
            ),
        "Shift",
            SWITCH (
                TRUE (),
                HOUR ( [Time] ) >= 16, "2nd",
                HOUR ( [Time] ) >= 8, "1st",
                "3rd"
            ),
        "StartOfHour", TIME ( HOUR ( [Time] ), 0, 0 ),
        "HalfHours",
            TIME ( HOUR ( [Time] ), 30 * ROUNDDOWN ( MINUTE ( [Time] ) / 30, 0 ), 0 ),
        "QtrHours",
            TIME ( HOUR ( [Time] ), 15 * ROUNDDOWN ( MINUTE ( [Time] ) / 15, 0 ), 0 )
    )
RETURN
    output
Example Changes
GENERATESERIES ( TIME ( 0, 0, 0 ), TIME ( 23, 59, 59 ), TIME ( 0, 0, 1 ) ) // 1 second granularity
GENERATESERIES ( TIME ( 0, 0, 0 ), TIME ( 23, 55, 0 ), TIME ( 0, 5, 0 ) ) // 5 minute granularity
Note: The data type of the Time, StartOfHour, HalfHours, and QtrHours needs to be changed to Time when you first create the DAX table.
Visualizing Time Series Data With Split Date and Time Tables
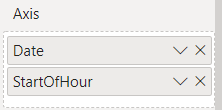
If your visual just covers one day, you can simply use the Time column from the Time table. However, since a DateTime column no longer exists, you can use both the Date (from the Date table) and the Time (from the Time table) in a hierarchy as demonstrated below.
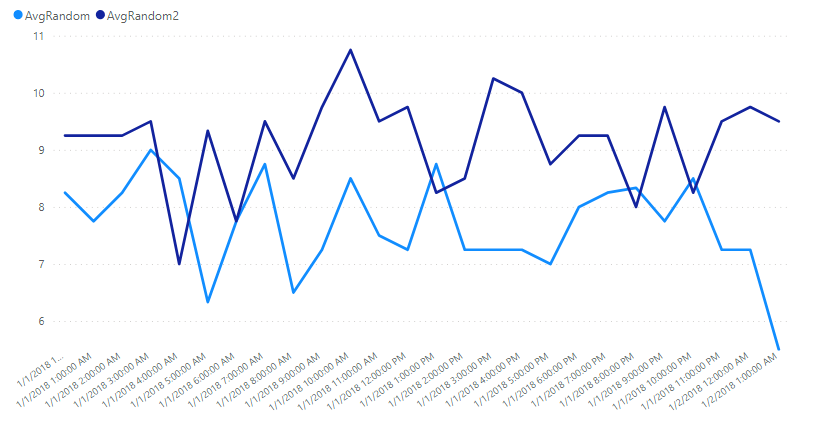
Alternatively, you can create a measure that combines the date and time values, and then use a visual that allows measure for axes/legends like Charticulator or Deneb.
I hope you find this article useful. It doesn't matter which one you use (DAX or M). I tend to use the M one, but use the one you feel more comfortable adapting to fit your needs. It is important to use as high a granularity as possible for your data (Days > Hours > Minutes > Seconds). The more rows you have to iterate over for your analyses, the worse performance will be.
