
Welcome to the inaugural post for HoosierBI.com! I get to use Power BI some as part of my day job as a chemist, but I have been also been volunteering with non-profits, schools, etc. to help them with their data on the side. Rob was nice enough to let me write a few articles on PowerPivotPro, and I enjoyed that enough that I decided to start up my own site. The site will focus on Power BI and will hopefully be yet another good resource to newcomers and/or people teaching others. There will also be articles on PowerApps, Flow, Azure Cognitive Services/Machine Learning, and/or Sharepoint too (but I'm still having plenty of fun with M and DAX for now). Guest posts will be welcomed, especially from those teaching others and/or working in a volunteer capacity.
The Microsoft team recently announced the addition of paginated reports to Power BI, which is great. However, currently it is only available on premium workspaces and for SQL Server data sources. The extension to other data sources is expected soon, and hopefully it will be offered outside of premium too. In any case, this article shows how one can generate paginated reports from any Power BI Desktop model.
Assuming you are already using Power BI, the first thing you'll need is to download and install SQL Server Report Builder (from here). Open it up and start a "New Report", choose which wizard you want to use (e.g., Table or Matrix Wizard), and choose "Create Dataset" and "Next". Create a "New" Data Source connection, select "Microsoft SQL Server Analysis Services" as the connection type (Power BI runs SSAS behind the scenes), and use the string "datasource=localhost:xxxxx" as your connection string, where "xxxxx" is the localhost number for your running Power BI Desktop model, as shown below.
Finding your localhost # is easy and there is a good article that shows you four different ways to do it here. I typically use DAX Studio to find it (as there is lots of other stuff you can do with DAX Studio), but searching for the file called "msmdsrv.port.txt" (while you have a pbix file open) is also an easy way. Remember that your Power BI desktop model needs to be open for this to work, and that your number will change each time you that pbix file.
In this example, I used a Power BI model based on the Northwinds database provided through and Odata feed, which is a relatively simple and small model good for demos/training, but this approach will work with any pbix model.
https://services.odata.org/V2/Northwind/Northwind.svc/
It is an OData2 feed and OData4 is the standard these days, but it is still helpful. I plan to write another article on how to get started with OData feeds and push the work to the server side to speed refresh times ($filter, $select, etc.).
After you set up the datasource, you'll see the Query Designer. In this window, you select the fields (columns) and measures you'd like to include in your report, to create a Dataset in Report Builder. Once the dataset is created, the rest is report building. You can find some good tutorials on the Microsoft site here (https://docs.microsoft.com/en-us/sql/reporting-services/report-builder-tutorials?view=sql-server-2017), and there are lots of videos on YouTube. Below is a screenshot of just a basic chart and matrix from the Northwinds data.
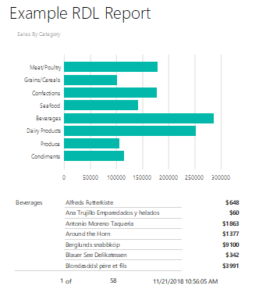
You can tell I didn't spend much time on the report (just starting out with Report Builder), but it is easy to use and looks to have many features/options. As you are building the report, you can toggle between "Run" and "Design" modes to see how it looks. When finished, you can print to PDF from "Run" mode. While this report can't be published to PowerBI.com at this time and therefore isn't scalable, it is a good way for an individual to make a paginated report that can be shared through email, etc.
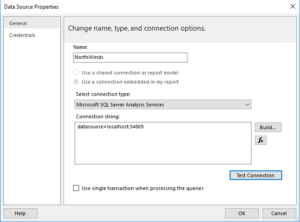
Note that the localhost number changes each time you open a given pbix file, so you will need to look up the number again and update your connection string in Report Builder when you want refresh the report. To do that, just right click on your Data Source and choose "Data Source Properties", and replace the 5-digit number in the connection string.
I hope this post helps at least a few of you. Thanks for visiting HoosierBI.com.


Nice article. I hadn't tried hooking up to Power BI Desktop directly as data source. And exporting to PDF is a nice hack.
Hey Pat,
Great post! You mention that only SQL Server is supported for Power BI Paginated Reports, have you had a chance to look into the Power BI On-Premises Data Gateway? This allows nearly all of the same data source types as SQL Server Reporting Services.
https://powerbi.microsoft.com/en-us/gateway/
Thanks,
Matt Jones
Power BI Pro Team, Microsoft
Thank you, Matt. I haven't done much with SSRS yet, so appreciate the tip.
Pat,
Thanks for the blog it is easy to understand. I have a scenario where I am wondering if you can point me in the right direction?
I currently do samples to an SQL server and use excel as a dashboard. I have excel querying every 7-10 seconds for the latest sample. This way I can show an element result written to the database almost instantly. However excel tends to get slower the longer I let this background query run. I have to restart the dashboard every few days. I am wondering if this is something I could resolve with Power BI or another tool?
I have tried to setup Power BI to the desktop but I must be missing something about how to make a dashboard live.
Btw, I'm a Hoosier too and in Columbus, IN.
Thanks,
I think you have a few good options, not knowing your application. With Power BI desktop (or Excel power query/power pivot), you can refresh on demand to get the latest data (vs. frequent refreshes). You can also set up a Direct Query connection to your database for real-time updates (there are pros/cons to that approach, so only do that if needed). If you publish a dashboard to the Power BI Service, you can set up automatic refresh (but the frequency is much less than every 7 seconds. Shoot me an email at [email protected] if you want to discuss in more detail.
Hi mate. you missed a bit "Finding your localhost # is easy and there is a good article that shows you four different ways to do it here -> (add link). <-"